
Mississippi Commercial Shrimp Industry
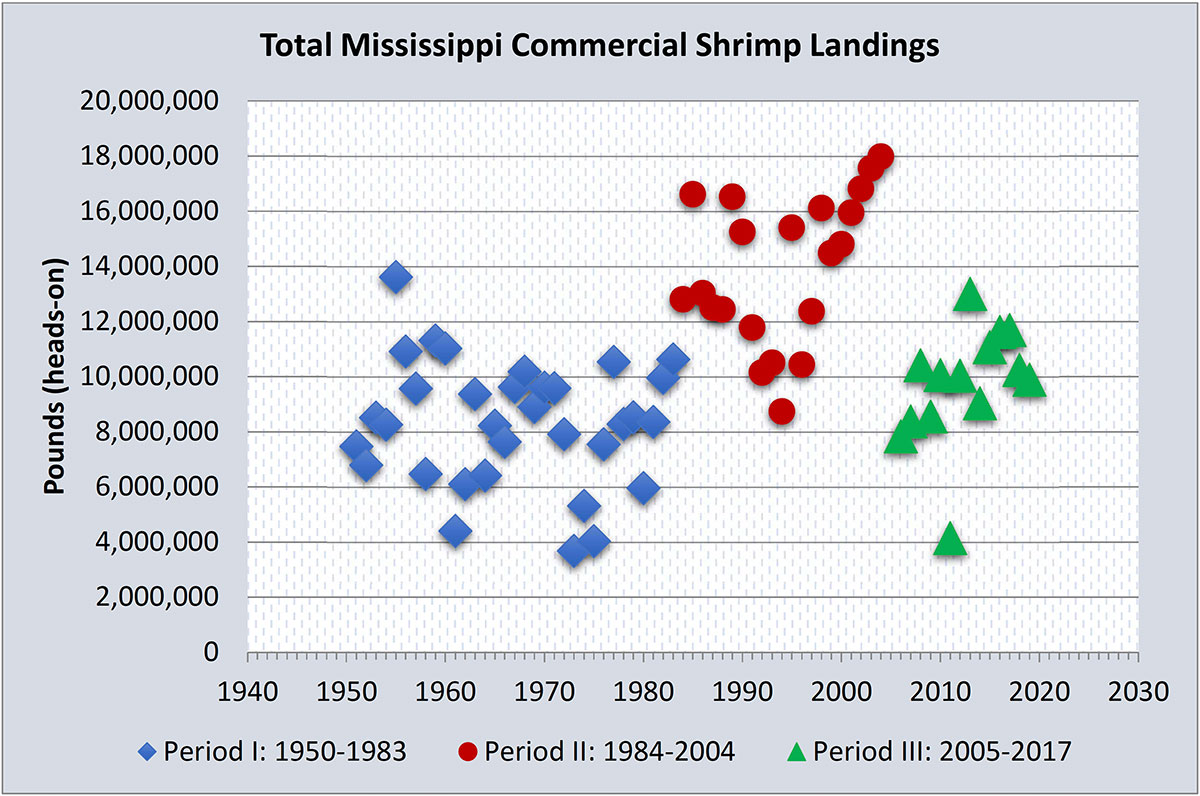
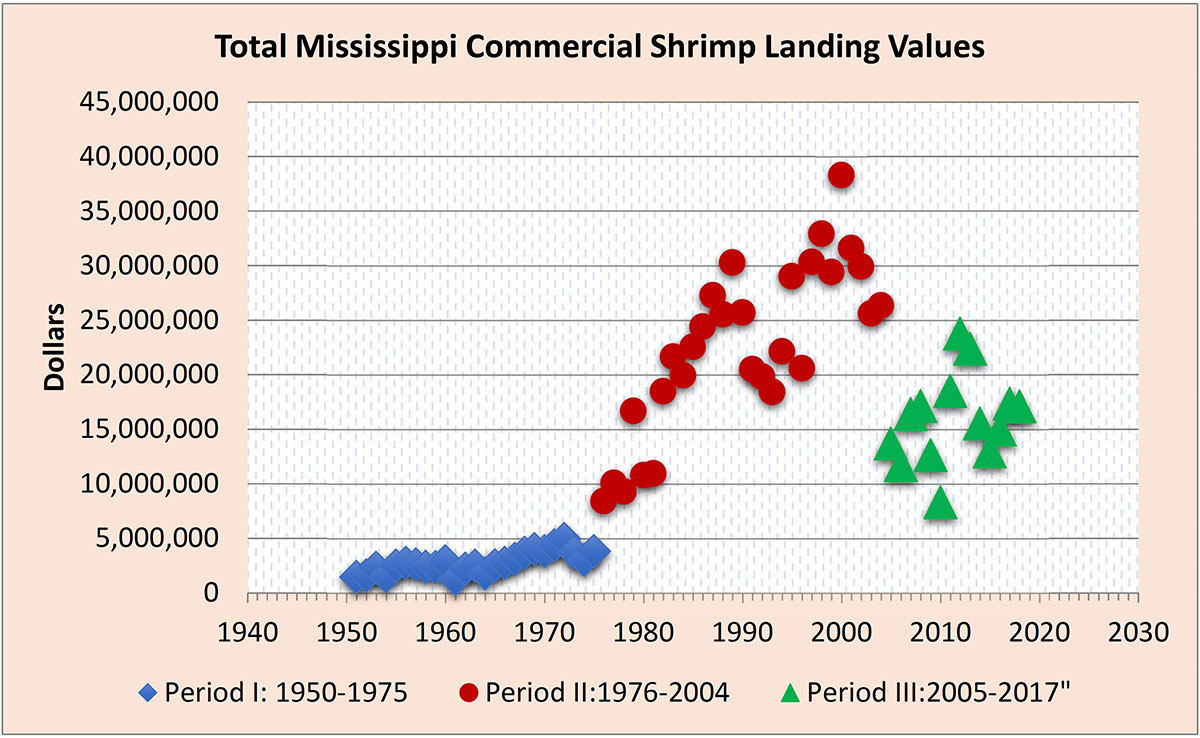
The annual Mississippi commercial landings and dockside values of all shrimp species primarily white and brown shrimp from 1950 to the present are shown below. From 1950 to 1983, yearly landings averaged about 8.3 million pounds valued at $5.3 million. Higher annual landings were reported from 1984 to 2004, averaging 14 million pounds, and valued higher at $26 million per year. Since 2005, commercial landings declined to less than 10 million pounds, valued lower averaging at $16 million per year.
In response to requests by state regulatory agencies and seafood organizations, the economic contributions of the Mississippi seafood industry by major species were imputed from state estimates published by NOAA Fisheries. Extension and research publications were developed to document the economic contributions of the major seafood species landed, processed, sold, and consumed in Mississippi.
Sales are the gross sales by businesses within the economic region affected by an activity. Sales, income, value-added, and tax contributions are measured in dollars. Employment or job contribution is expressed in terms of a mix of both full-time and part-time jobs. The total economic contribution is the sum of direct, indirect, and induced contributions.
The economic contributions of the shrimp industry in 2009 are shown in the table below. The sales contributions reached $142 million in 2009 and generated over 3,000 full-time and part-time jobs. Income contribution was $57 million, and value-added created was $73 million. The industry added tax impacts over $6 million.
| 2009 Economic Impacts of Mississippi Shrimp Industry By Sector Without Imports | |||||
| Sector | Sales impacts (M$) |
Job impacts | Income impacts (M$) |
Value-added impacts (M$) |
Indirect tax impacts (M$) |
| Harvesting | 20.27 | 412 | 6.27 | 9.08 | 0.62 |
| Processing | 53.65 | 711 | 21.23 | 26.60 | 1.06 |
| Wholesaling | 7.82 | 84 | 2.76 | 3.48 | 1.01 |
| Fish markets | 9.29 | 220 | 4.59 | 5.64 | 1.33 |
| Restaurants | 50.75 | 1,664 | 22.59 | 28.54 | 2.72 |
| Total | 141.77 | 3,091 | 57.44 | 73.34 | 6.73 |
Table 1 shows estimates of the 2009 economic contributions of the Mississippi shrimp industry from MAFES Bulletin 1209.
The 2011 economic contributions of the Mississippi shrimp industry are shown in the table below. The sales contributions of the shrimp industry reached more than $132 million in 2011. The industry created almost 3,000 full-time and part-time jobs in the same year and generated income contribution of over $52 million. The industry produced value-added contributions reaching more than $67 million and tax impacts over $10 million.
| 2011 Economic Impacts of Mississippi Shrimp Industry By Sector Without Imports | |||||
| Sector | Sales impacts (M$) |
Job impacts | Income impacts (M$) |
Value-added impacts (M$) |
Tax impacts (M$) |
| Harvesting | 30.14 | 592 | 9.06 | 13.32 | 1.47 |
| Processing | 41.80 | 552 | 16.54 | 20.72 | 1.55 |
| Wholesaling | 5.10 | 55 | 1.80 | 2.27 | 0.57 |
| Fish markets | 7.64 | 181 | 3.78 | 4.64 | 1.28 |
| Restaurants | 47.44 | 1,550 | 21.13 | 26.69 | 5.39 |
| Total | 132.13 | 2,929 | 52.30 | 67.64 | 10.26 |
Table 2 shows estimates of the 2011 economic contributions of the Mississippi crab industry from Economic Impact Crab.
Updated 2015 estimates of the economic contributions of the shrimp industry in Mississippi are shown below. The sales contribution totaled $215 million and generated 4,276 full-time and part-time jobs. Income contribution was $88.5 million, and valueadded created was $112.4 million.
| Economic contributions of Mississippi shrimp industry by sector and type, 2015 | |||||
| Sector | Sales contributions (M$) |
Job contributions | Income contributions (M$) |
Value-added contributions (M$) |
|
| Commercial harvesters | 19.7 | 367 | 6.2 | 8.9 | |
| Seafood processors & dealers | 81.9 | 977 | 32.4 | 40.6 | |
| Seafood importers | 0.5 | 2 | 0.1 | 0.2 | |
| Seafood wholesalers & distributors | 14.2 | 138 | 5.0 | 6.3 | |
| Seafood retailing | 99.0 | 2,792 | 44.8 | 56.4 | |
| Total | 215.4 | 4,276 | 88.5 | 112.4 | |
Table 3 shows the estimates of the 2015 economic contributions of the Mississippi shrimp industry from MSU Extension publication 3194.
Sectoral Economic Impacts of Seafood Industry