
Mississippi Commercial Landings
The annual Mississippi commercial Eastern oyster landings (in million pounds) since 1980 are shown below. There were many years between 1880 and 1948 when data on annual landings were unavailable. The data from 1880 to 1949 were retrieved from available copies of NOAA Fisheries' annual reports. The data from 1950 to 2018 were compiled from the NOAA Fisheries website. No commercial oyster landings have been reported from 2019 to 2022.
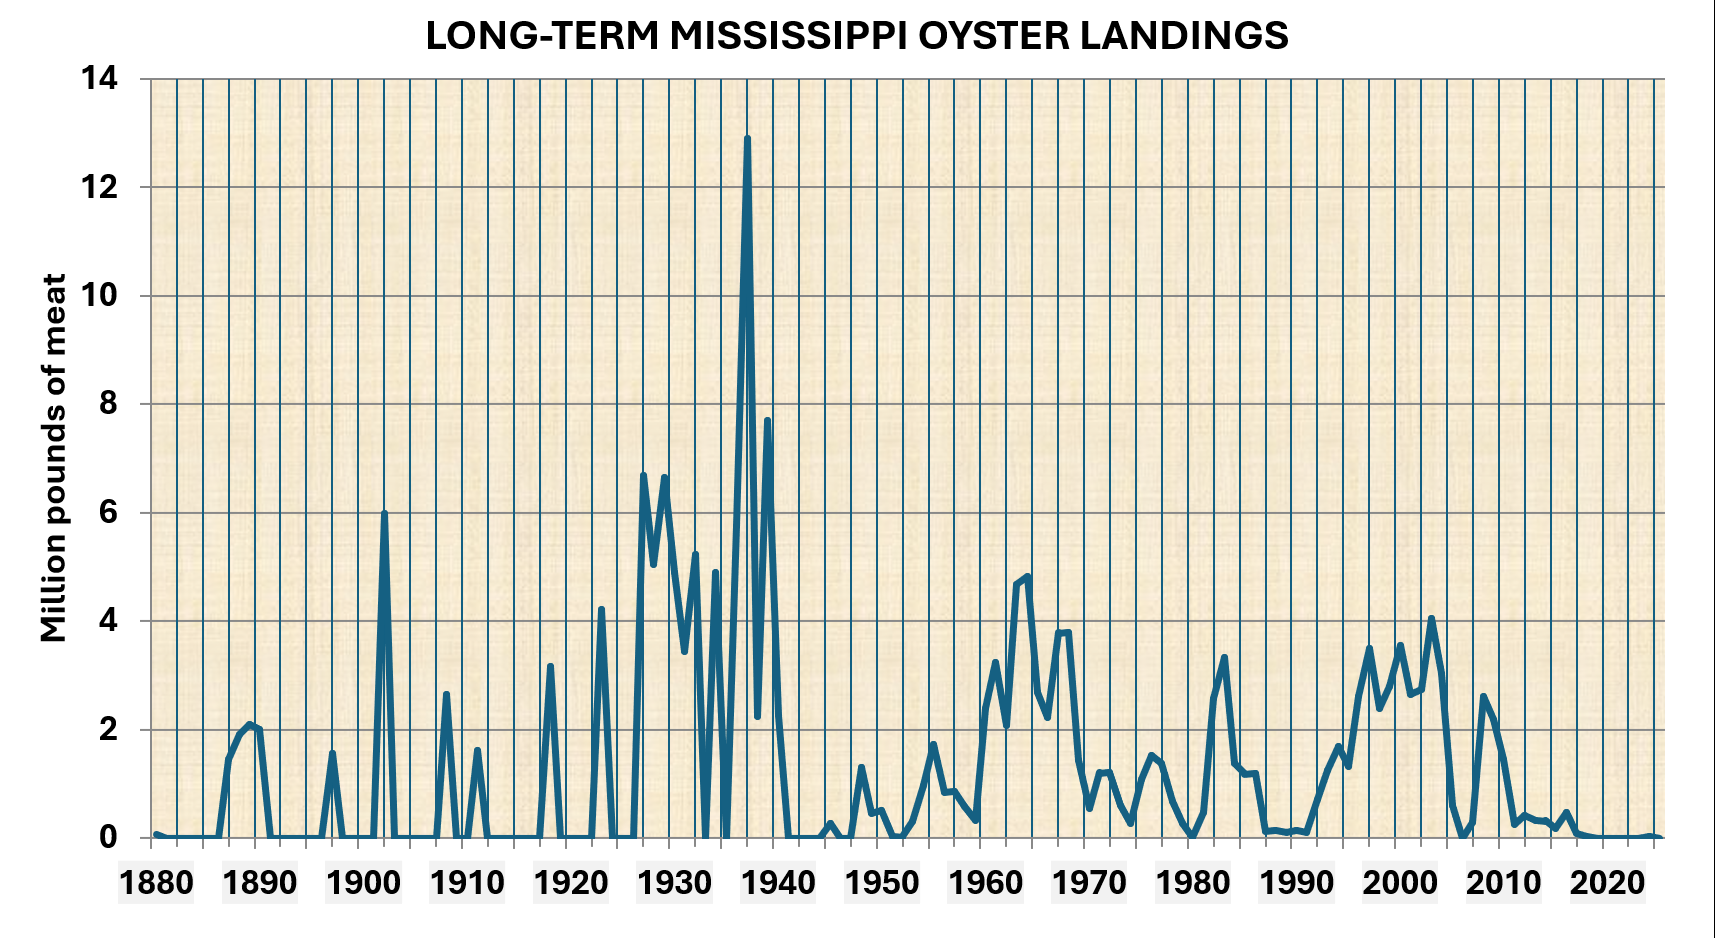
The most recent mass mortalities of oysters in the state's public reefs and oyster farms were reported during the multiple, prolonged openings of the Bonnet Carre Spillway between March and July 2019. As a result, the state public oyster reefs have been closed to harvesting since then. Except for oyster harvests from off-bottom farms near Deer Island, no commercial oyster landings were recorded between March 2019 and December 2023.
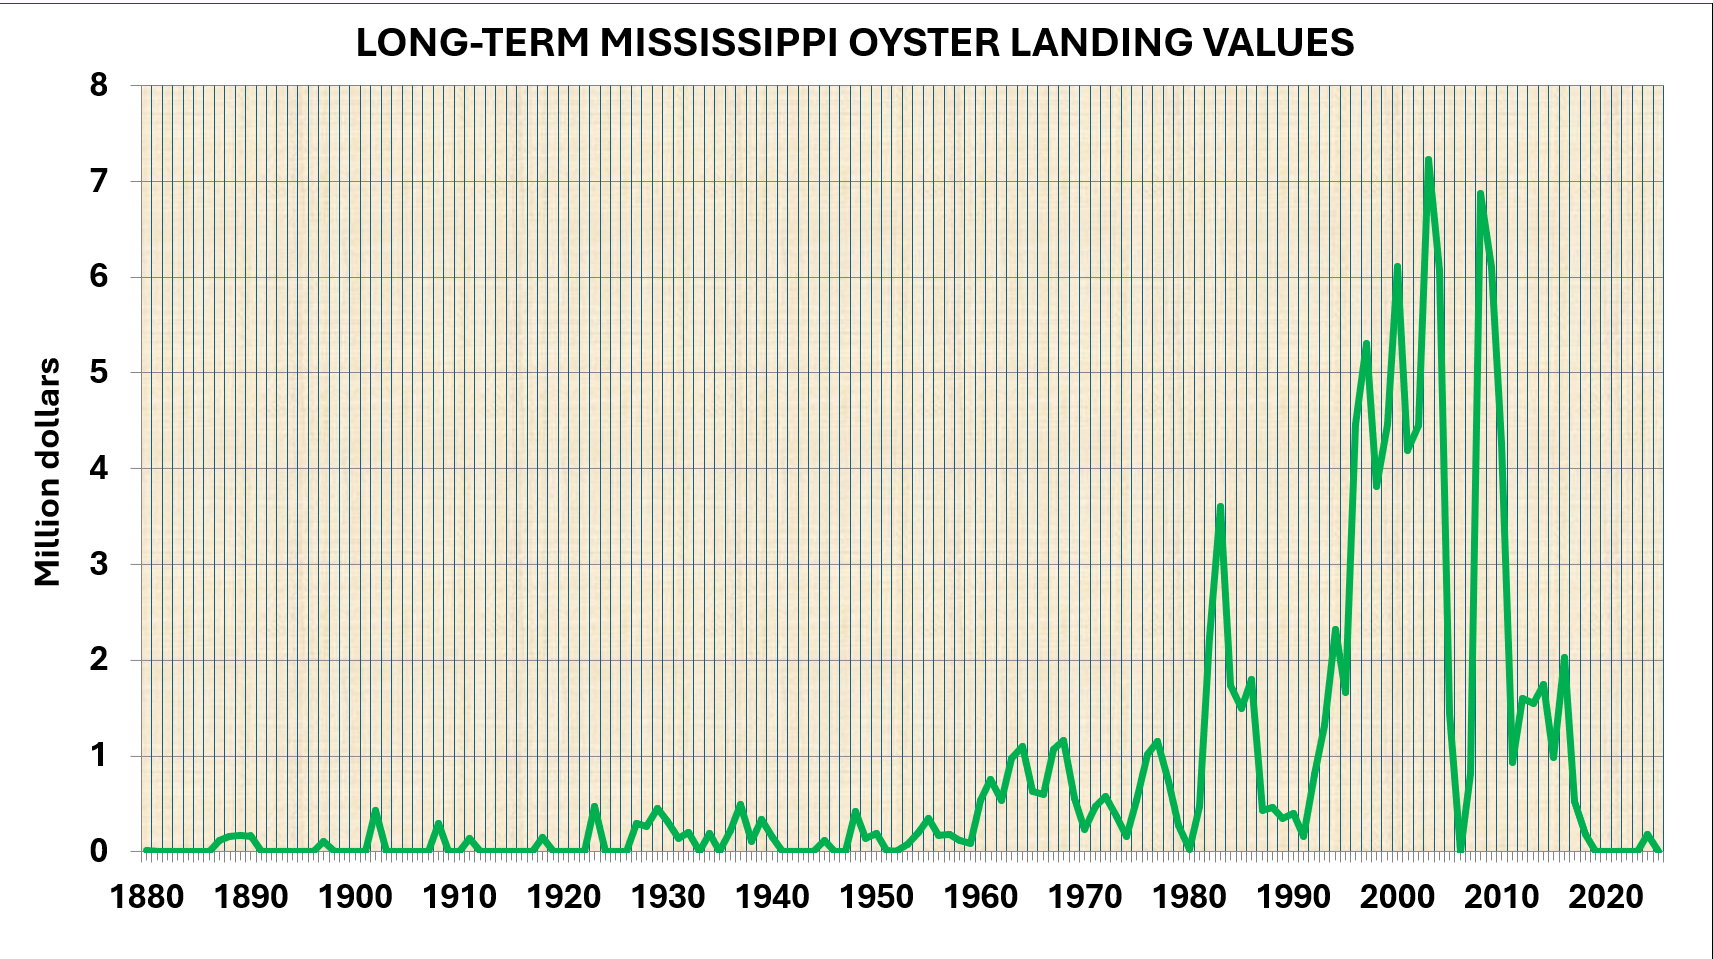
Economic Contributions by Major Species
In response to requests by state regulatory agencies and seafood organizations, the 2009 (and later) economic contributions of the Mississippi seafood industry by major species were imputed from state estimates published by NOAA Fisheries. Extension and research publications were developed to document the economic contributions of Mississippi's major seafood species that landed, processed, sold, and consumed.
This report includes four types of economic impacts: sales, jobs, income, and value-added. These impacts are not additive. Each type represents a specific reported economic activity. Income, value-added, and sales impacts are expressed in dollars for the year specified by the user. Sales are the gross sales of businesses within the economic region affected by an activity. Labor income includes personal income, such as wages and salaries, and proprietors' income, or income from self-employment. Employment impacts are expressed as a mix of full-time and part-time jobs.
Mississippi Oyster Industry in 2009
The economic contributions of the oyster industry in 2009 are shown in Table 1 below. The sales contributions reached $23.72 million in 2009, generating 562 full-time and part-time jobs. The income contribution was $9.0 million, and the value-added created was $11.9 million. The industry-added tax impacts reached $1.15 million.
|
2009 Economic Impacts of Mississippi Oyster Industry By Sector |
|||||
|---|---|---|---|---|---|
| Sector |
Sales impacts (M$) |
Job impacts |
Income impacts (M$) |
Value-added impacts (M$) |
Indirect tax impacts (M$) |
| Harvesting |
9.77 |
199 |
3.02 |
4.38 |
0.30 |
| Processing |
2.62 |
35 |
1.04 |
1.30 |
0.05 |
| Wholesaling |
1.58 |
17 |
0.56 |
0.70 |
0.21 |
| Fish Markets |
0.83 |
20 |
0.41 |
0.50 |
0.12 |
| Restaurants |
8.92 |
292 |
3.97 |
5.02 |
0.48 |
| Total |
23.72 |
562 |
9.00 |
11.90 |
1.15 |
Mississippi Oyster Industry in 2011
The economic impacts of the Mississippi oyster industry in 2011 are shown in Table 2 below. The industry's sales impact reached $13.47 million in 2011, creating about 354 full-time and part-time jobs that year. Income contribution was $5.62 million, and value-added created was $7.18 million. The industry-added tax impacts reached $1.32 million.
|
2011 Economic Impacts of Mississippi Oyster Industry By Sector Without Imports |
|||||
|---|---|---|---|---|---|
| Sector |
Sales impacts (M$) |
Job impacts |
Income impacts (M$) |
Value-added impacts (M$) |
Tax impacts (M$) |
| Harvesting |
1.51 |
30 |
0.45 |
0.67 |
0.07 |
| Processing |
1.91 |
25 |
0.75 |
0.95 |
0.07 |
| Wholesaling |
1.03 |
11 |
0.37 |
0.46 |
0.11 |
| Fish Markets |
0.68 |
16 |
0.34 |
0.41 |
0.11 |
| Restaurants |
8.34 |
272 |
3.71 |
4.69 |
0.95 |
| Total |
13.47 |
354 |
5.62 |
7.18 |
1.32 |
Mississippi Oyster Industry in 2015
The 2015 estimates of the economic contributions of Mississippi's combined crab and oyster industries are shown in Table 3 below. Due to the confidentiality of the 2015 data, NOAA Fisheries combined estimates for the two species. The combined sales contributions totaled $35 million and generated 831 full-time and part-time jobs. Pooled income contributions were $14.8 million, and the value added created was $18.9 million.
|
2015 Economic contributions of Mississippi oyster and crab industry by sector |
||||
|---|---|---|---|---|
| Sector |
Sales contributions (M$) |
Job contributions |
Income contributions (M$) |
Value-added contributions (M$) |
| Commercial harvesters |
3.4 |
63 |
1.1 |
1.5 |
| Seafood processors & dealers |
4.0 |
48 |
1.6 |
2.0 |
| Seafood importers |
0.0 |
0 |
0.0 |
0.0 |
| Seafood wholesalers & distributors |
3.2 |
31 |
1.1 |
1.4 |
| Seafood retailing |
24.4 |
689 |
11.1 |
13.9 |
| Total |
35.0 |
831 |
14.8 |
18.9 |
Mississippi Oyster Industry in 2020
Table 4 below shows the 2020 estimates of the economic contributions of Mississippi's combined crab and oyster industries. Due to the confidentiality of the 2020 data, NOAA Fisheries combined estimates for the two species. The combined sales contributions totaled $24.6 million and generated 542 full-time and part-time jobs. Pooled-income contributions were $10.4 million, and the value-added created was $15.2 million.
|
2020 Economic contributions of Mississippi oyster and crab industry by sector |
|||||
|---|---|---|---|---|---|
| Sector |
Sales contributions (M$) |
Job contributions |
Income contributions (M$) |
Value-added contributions (M$) |
Percent |
| Commercial harvesters |
2.1 |
37 |
0.7 |
1.1 |
8.7% |
| Seafood processors & dealers |
3.1 |
35 |
1.2 |
1.8 |
12.7% |
| Seafood importers |
0.0 |
0 |
0.0 |
0.0 |
0.0% |
| Seafood wholesalers & distributors |
2.4 |
21 |
0.8 |
1.2 |
9.6% |
| Seafood retailing |
17.0 |
449 |
7.7 |
11.1 |
69.0% |
| Total |
24.6 |
542 |
10.4 |
15.2 |
100.0% |
Mississippi Oyster Industry in 2023
Table 5 shows the Mississippi commercial oyster industry's contributions to the state economy in 2023. The oyster industry added $10.2 million in sales, created 168 jobs, generated a total personal income of $4.3 million, and added $5.4 million in value-added contributions to the state economy. Retailing (54.7%), processing (28.2%), and wholesaling (17.2%) were the most significant parts of the state oyster and crab industry in 2023. No oyster harvesting was reported from 2019 to 2023 due to the 2019 Bonnet Carré Spillway disaster.
|
2023 Economic contributions of Mississippi oyster and crab industry by sector |
||||
|---|---|---|---|---|
| Sector |
Sales contributions (M$) |
Job contributions |
Income contributions (M$) |
Value-added contributions (M$) |
| Commercial harvesters |
0.0 |
0 |
0.0 |
0.0 |
| Seafood processors & dealers |
2.9 |
28 |
1.1 |
1.4 |
| Seafood importers |
0.0 |
0 |
0.0 |
0.0 |
| Seafood wholesalers & distributors |
1.7 |
14 |
0.6 |
0.8 |
| Seafood retailing |
5.5 |
126 |
2.5 |
3.2 |
| Total |
10.2 |
168 |
4.3 |
5.4 |
Overall, the Mississippi oyster industry has not yet recovered from the damage caused by recent disasters, especially the 2019 Bonnet Carre Spillway disaster and the global pandemic. These estimates are not additive. Separate measures such as sales, output, and value added track the same underlying dollars through different lenses, so they overlap rather than stack. Combining separate event estimates counts the same transactions more than once, i.e., double counting.
MISSISSIPPI MARKETMAKER
- Dockside and Wholesale Prices of Oysters
Commercial Oyster Harvesting - Commercial Eastern Oyster Fishing in the Gulf of Mexico States
- Mississippi Oyster Season to Open in October
- Know Your Local Seafood Business Handling Oyster Products!
- Economic Contributions of the MS Seafood Industry by Major Species in 2015